Understanding Harmonics
In my last article,
I discussed the physics behind octaves and their significance in music. I also wrote about
the low-end frequency response of loudspeakers, and which frequencies produce the lowest
sounds in music. The high end of an audio system’s frequency response has little to
do with musical notation, but is crucial for conveying the different sounds of different
instruments. This article introduces the concept of harmonics and explains how they
enrich the musical experience.
An object vibrates at a particular frequency that depends
on the object’s size, shape, and material. However, no object vibrates at only one
frequency. The lowest frequency at which an object vibrates is called its fundamental
frequency, but it also vibrates at integer multiples of that frequency, called harmonics.
For example, a string vibrating at 220Hz is also vibrating at 440Hz, 660Hz, 880Hz, 1100Hz,
and so on.
Consider a string that is fixed at both ends, as on a
violin or guitar. The string’s fundamental frequency is determined by its mass,
length, and tension. The length of the string is equivalent to half the wavelength
of the associated pitch. If you could observe the minute movements of the string, you
would see an arc moving up and down, as in the animation of Figure 1.
.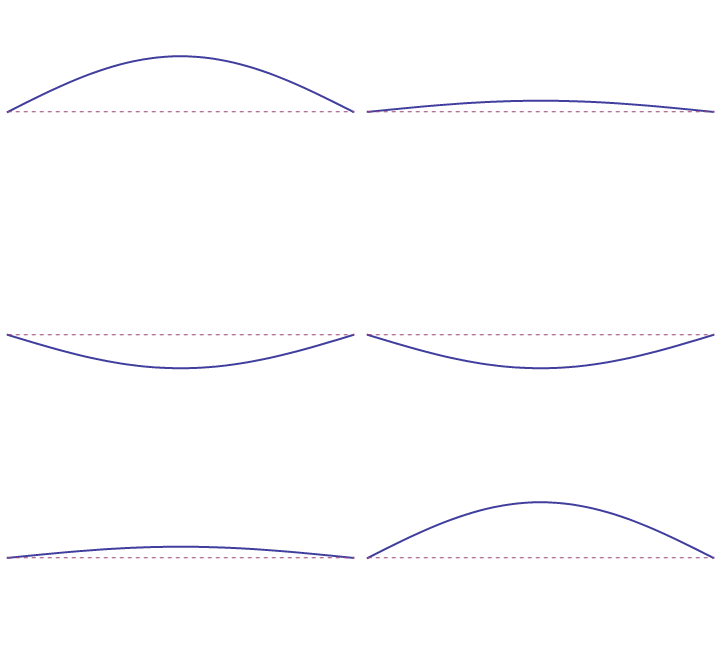
Figure 1
Each point at which the string, as it oscillates, crosses
the zero position is called a node. In this case, there is one node at each end of
the string. Harmonics result from the introduction of nodes that divide the string into
equal sections. If you place your finger lightly on a vibrating string at the
string’s midpoint, you’ll hear a pitch an octave higher than the fundamental,
along with a little bit of the fundamental frequency. By creating a node with your finger,
you have halved the wavelength -- and therefore doubled the frequency -- of the sound the
string is producing. If you place two fingers on the string, thus dividing it into
thirds, you would cause one-and-one-half wavelengths to occupy the length of the string --
and hear thrice the fundamental frequency. If you were to continue to add fingers, you
would reach higher integer multiples of the fundamental frequency. The animation in Figure
2 shows the continual division of the string into equal sections.
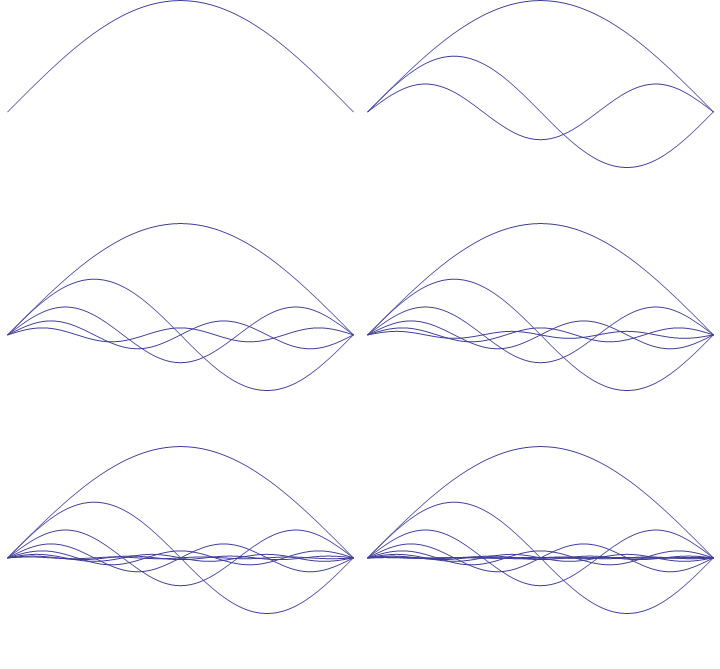
Figure 2
But even if you don’t place your fingers at the nodes,
they’re still there, and the string is still vibrating at all of these frequencies,
though typically at lower amplitudes (i.e., they’re less loud) than that of
the fundamental frequency. By placing your fingers at the node points, you damp the lower
frequencies to allow the upper ones to be heard.
Though I’ve thus far referred to separate pitches, the
sound that reaches our ears is actually the sum of these individual frequencies:
fundamental plus harmonics. Because the ear-brain system doesn’t separate the
soundwave of this note into its constituent parts, what we hear is not many notes, but a
single note of a particular timbre.
Consider an object that is vibrating at 220Hz (the A below
middle C), and that each subsequent harmonic of that pitch has half the amplitude of the
previous one: 440Hz is half as loud as 220Hz, 880Hz is half as loud as 440Hz, and so on.
What we hear is a single soundwave that is the sum of these individual soundwaves.
The graph in Figure 3 shows the waveform of the fundamental
frequency -- a sinewave -- in black, and the summed waveforms of the first five harmonics
in blue.
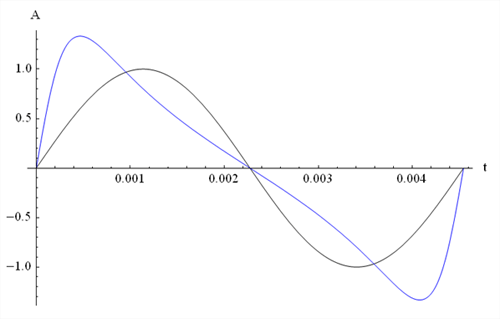
Figure 3
The two waveforms not only look different on a graph, but
sound very different from each other.
Listen to the fundamental
frequency alone. Here is the fundamental frequency
with its harmonics, as described above.
Actual musical instruments do not tend to follow a simple
geometric series such as is illustrated above. That is, each consecutive frequency is not
in some constant ratio to the previous one. The relative loudness of each harmonic is
determined by the way in which the instrument is constructed and played. In a stringed
instrument, it is not only the string that vibrates, but the body of the instrument as
well. The sound that we hear from an instrument is the sum of the vibrations of all
of its parts at all of their harmonics.
It’s possible to graph the harmonic structure of a
particular instrument playing a particular note. Figure 4 represents a sample of Yo-Yo Ma
playing the first note of the Suite No.1 for Solo Cello by J.S. Bach [CD, CBS M2K 36867].
Performing a Fast Fourier Transform (FFT) on the sample, we obtain the following spectrum
with frequency, in hertz (Hz), along the horizontal axis, and relative amplitude
along the vertical axis. The height of each peak is each frequency’s
amplitude, which corresponds with how loudly we hear that frequency.
Cello
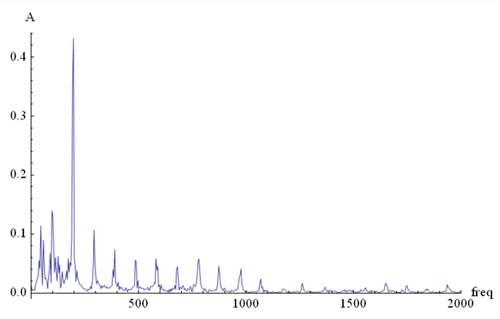
Figure 4
The highest peak on the graph appears just below 200Hz. It
would be reasonable to assume that this frequency must be the fundamental -- in other
words, the note that Bach wrote should be the strongest pitch heard. However, when you
look at the musical score, you see that the first note is actually G1, at 98Hz. But on the
graph, 98Hz is the second-highest peak. The highest peak, at 196Hz, is the first
harmonic of the actual notated pitch of G1/98Hz. On the cello, it is the first
harmonic that dominates the sound. Successive harmonics decrease in amplitude out to the
tenth harmonic, and further activity can be seen even beyond that point. (The peaks below
98Hz are not harmonics of the bowed string, but resonances of the cello’s body and/or
the room in which it was recorded.)
Remember that the note we hear is actually the combination
of all of these discrete vibrations. In order for this 98Hz G1 to be heard as it was
recorded, and not as a pure 98Hz sinewave, an audio playback system must be able to
reproduce the cello’s precise combination of vibrations at 98Hz, 196Hz, 294Hz, up to
even 980Hz. If the playback system can’t produce all of these frequencies, or
produces them in different proportions (relative amplitudes) than those shown in the above
graph, we won’t hear the instrument’s timbre.
Bach wrote no suites for unaccompanied trombone, so
trombonists such as myself have been forced to borrow his wonderful works for solo cello.
A trombone sounds very different from a cello, and we can see a representation of that
difference on a plot of the frequency spectrum of the same note. Figure 5 shows the cello
spectrum of the first note of Suite No.1 plotted out to 500Hz in black, overlaid in blue
with the same note’s spectrum as played by me on trombone.
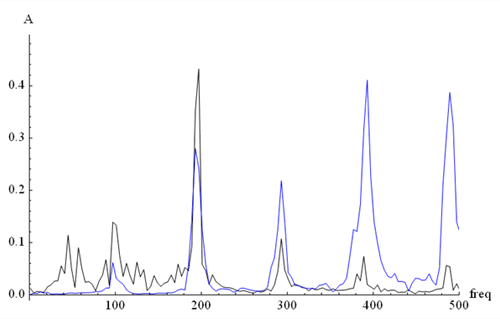
Figure 5
With this graph we can clearly see that the peaks of the
cello and trombone notes are in the same places along the frequency axis, but that their
heights, or amplitudes -- and thus their relative loudnesses -- are very different. Though
the two instruments play the same written pitch, they sound different because of the
relative proportions of each instrument’s harmonic series. If we plot the
trombone’s spectrum all the way out to 2000Hz, as we did for the cello, we see that
the sound of the trombone is significantly richer in upper harmonics than the sound of the
cello. We also see that, whereas the cello’s sound is dominated by its first
harmonic, the loudest component of the trombone’s sound is its fifth harmonic.
Trombone
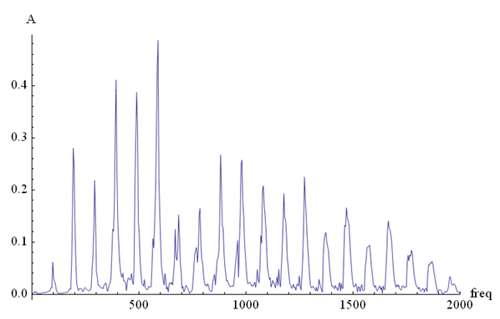
Figure 6
Figure 6 shows that the harmonic series of a note can
extend to up to 20 times its fundamental frequency. Many instruments routinely play in the
range of 500-1000Hz, which implies that their harmonic structures reach up as far as
10,000-20,000Hz. Human voices are no different -- each has a unique harmonic structure. A
soprano can sing up to 1000Hz, with relevant harmonics to 10,000Hz and beyond. The highest
note on a pipe organ has a fundamental frequency of 7000Hz. It is therefore likely that
the harmonic information of this note goes far beyond the upper limit of human hearing.
Because we can hear the harmonic series of an instrument,
we can distinguish between a trombone and a cello that are playing the same pitch. In the
same way, although the differences are not nearly as great, we can also distinguish
between a cello and a viola, or between a trombone and a trumpet, or between an oboe and
an English horn. Each individual sample of a single instrument type also has a unique
frequency spectrum -- two different violins will have different spectra. Even the same
instrument in the hands of the same musician can produce subtly different spectra,
depending on how, say, the cellist bows or the trombonist positions his mouth on the
mouthpiece. As these differences become more subtle, they become increasingly difficult to
measure electronically.
This basic understanding of harmonics can be applied to the
evaluation of audio equipment. If a system’s frequency response is curtailed --
whether cut off or rolled off -- then it will reproduce only a portion of the harmonic
series. If the system can produce all of the requisite frequencies but cannot do so
linearly, then the relative amplitudes will not be heard in their correct ratios when
played back. Heard over a cell phone, even instruments as different from each other as a
trombone and a cello can be difficult to tell apart. The trombone and cello are
distinguishable through the vast majority of car stereos and boom boxes, but a viola and a
cello may not be. The differences between a viola and a violin are smaller yet, but a
system that purports to be "hi-fi" should be able to clearly make the
distinction.
As you become aware of more and more subtle aspects of
sound, distortion begins to become more important than simple frequency response. No
combination of recording and playback equipment can perfectly reproduce the complex
harmonic structure of any instrument, but some systems can come closer than others, and
the very best can convey the differences between instruments of the same type, and even
the subtlest changes in the way the same instrument is played from note to note. This is
how the best systems bring us closest to the experience of hearing music performed live.
...S. Andrea Sundaram
|